Power BI Interactive Map for Australian Critical Minerals Prospectus
Data-Driven has successfully developed an advanced Power BI solution for the Australian Critical Minerals Prospectus, transitioning from static PDF reports to an interactive, visually appealing digital format. This project aimed to make critical minerals data more accessible and user-friendly while retaining the marketing flair of its previous versions.
Australia is well-endowed with critical minerals required to produce vital components such as electric vehicles, solar panels, hydrogen technology, and batteries.
By investing in these minerals and associated technologies, we can drive a future built in Australia, fueled by renewable energy, and generate more employment opportunities for Australians.
The Government is also supporting critical minerals projects through various initiatives, including the $4 billion Critical Minerals Facility and the newly launched $7 billion Critical Minerals Production Tax Incentive.
Project Overview
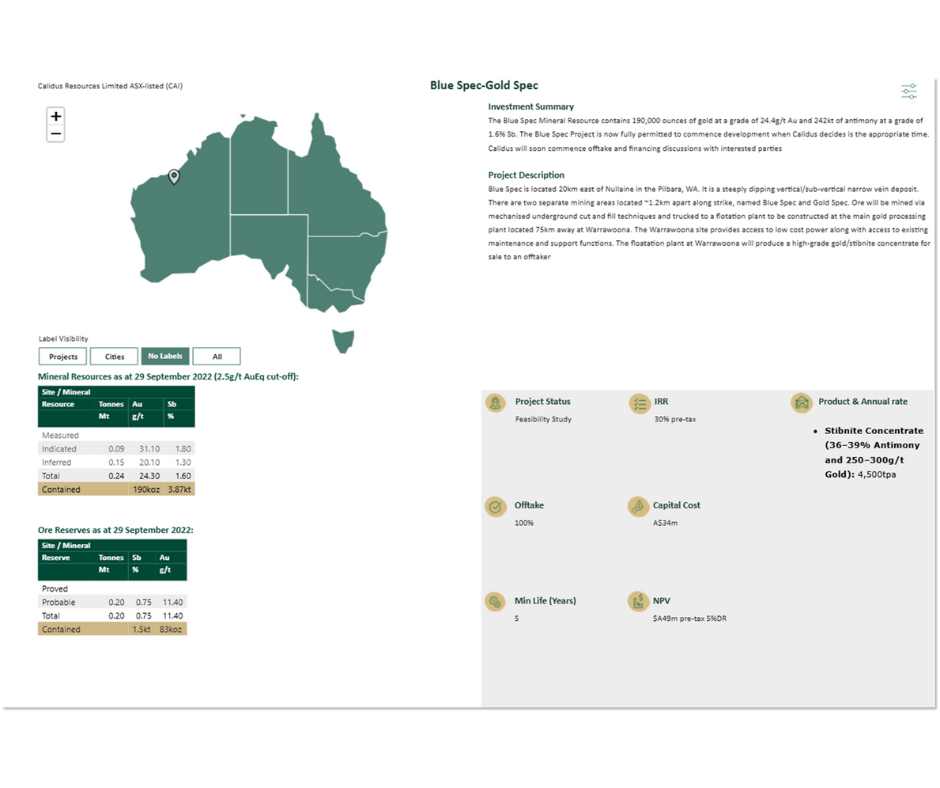
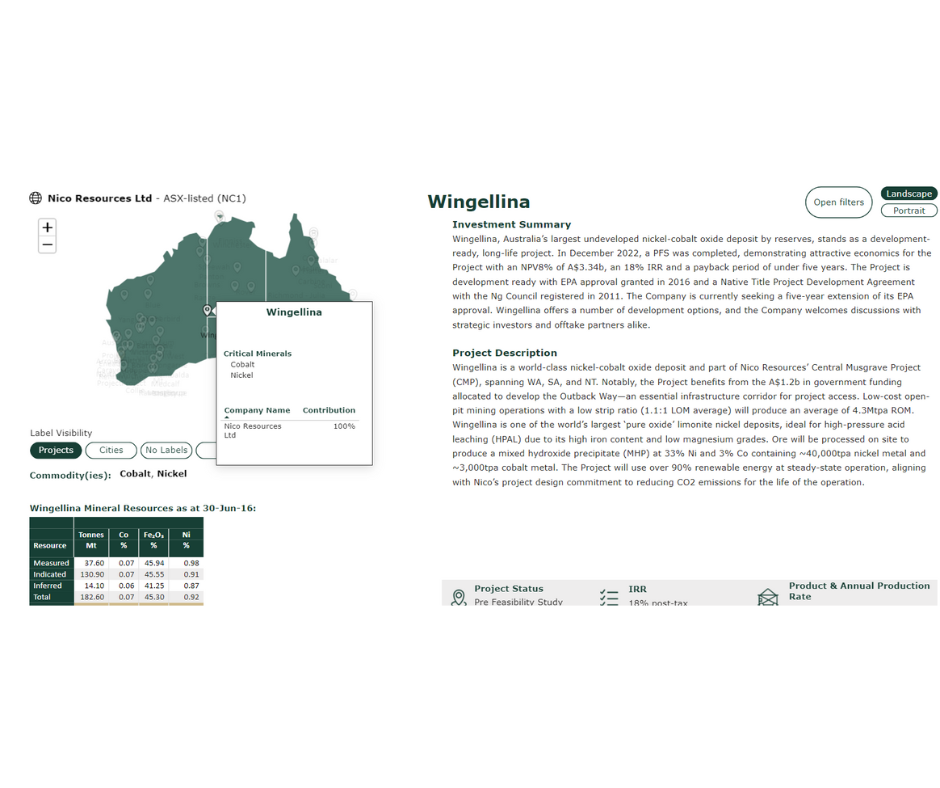
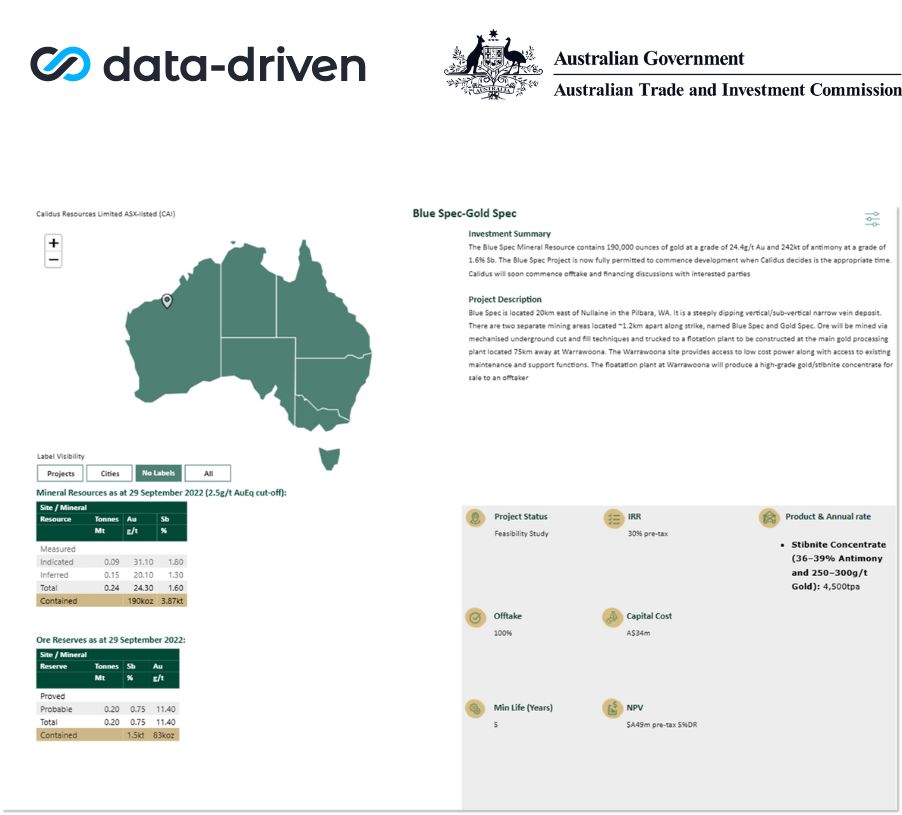
The main goal of this project was to redevelop the Australian Critical Minerals Prospectus, a key resource for investors and stakeholders. The new Power BI solution includes an interactive map of Australia, highlighting state and territory boundaries, with project pins based on geographic coordinates. This dynamic map provides detailed information on mineral projects across the country, making it easier for users to navigate and access data.
Key Features
- Interactive Map with State and Territory Boundaries:
The map highlights Australian states and territories with clickable pins representing individual projects. Each pin is linked to detailed information on the project, including its phase, critical mineral, and associated company.
- Filters and Search Functionality:
Users can filter and search for projects by multiple criteria—state, critical mineral, project phase, company, or project name—providing an intuitive and flexible way to explore the dataset.
- Project Information Display:
Each project displays relevant data, such as project status, mineral type, and company information. This structured data presentation ensures users can quickly grasp the project’s scope and status.
- Embedding Capability for Public Website:
The solution includes the ability to embed the interactive map on public websites, offering broader access to stakeholders and the general public.
- Data Cleansing and Transformation Support:
To ensure data accuracy and consistency, Data-Driven provided support for data cleansing and transformation, ensuring that the information displayed is reliable and up to date.
Delivering on Key Objectives
Data-Driven met the primary objectives by:
- Improving Data Management: By integrating Power Apps, Data-Driven enhanced the management and flow of data. This ensured that updates to the mineral prospectus could be handled smoothly and reflected in real-time within the Power BI dashboards.
- Creating a Visually Appealing Interface: The Power BI interface retains the marketing flair of the previous PDF versions while improving the accessibility and interactivity of the data.
- Ensuring Simplicity and Accessibility: The final solution is user-friendly, allowing stakeholders from various backgrounds to easily access and analyze critical minerals data.
Conclusion
The Power BI interactive map and data visualization solution delivered by Data-Driven marks a significant upgrade to the Australian Critical Minerals Prospectus. This modern, interactive platform improves the accessibility of essential information, supporting informed decision-making for investors, policymakers, and other stakeholders. The transition to Power BI ensures that the Australian critical minerals industry is presented in a dynamic and engaging manner, paving the way for future innovations in data presentation.
